三、建立一个简单的交易策略
大约 2 分钟
1.导入pandas和matplotlib.pyplot
import pandas as pd
import matplotlib.pyplot as plt
2. 修改股票数据并添加两列—MA10和MA50
#导入FB的股票数据,添加两列- MA10和MA50
#import FB's stock data, add two columns - MA10 and MA50
#使用dropna删除任何“非数字”数据
#use dropna to remove any "Not a Number" data
fb = pd.read_csv('data/facebook.csv',index_col=0)
fb.index=pd.to_datetime(fb.index)
fb['MA10'] = fb['Close'].rolling(10).mean()
fb['MA50'] = fb['Close'].rolling(50).mean()
fb = fb.dropna()
fb.head()| Date | Open | High | Low | Close | Adj Close | Volume | MA10 | MA50 |
|---|---|---|---|---|---|---|---|---|
| 49 | 2015-03-13 | 22.559999 | 22.760000 | 22.250000 | 22.700001 | 22.116024 | 8982200 | 22.648 |
| 50 | 2015-03-16 | 22.879999 | 23.110001 | 22.730000 | 22.969999 | 22.379078 | 5923900 | 22.685 |
| 51 | 2015-03-17 | 22.920000 | 23.260000 | 22.760000 | 23.250000 | 22.651876 | 7497500 | 22.792 |
| 52 | 2015-03-18 | 23.250000 | 23.370001 | 22.660000 | 22.870001 | 22.281652 | 10337600 | 22.836 |
| 53 | 2015-03-19 | 22.950001 | 23.299999 | 22.780001 | 23.219999 | 22.622650 | 7768900 | 22.872 |
3.增加“股票”一栏,根据策略做出决策
#添加新列“Shares”,如果MA10>MA50,记为1(多头一股),否则记为0(什么都不做)

fb['Shares'] = [1 if fb.loc[ei, 'MA10']>fb.loc[ei, 'MA50'] else 0 for ei in fb.index]
#添加一个新的列“利润”,使用列表推导,对于fb中的任何行,如果Shares=1,利润计算为收盘价
#明天-今天的收盘价。否则利润为0。
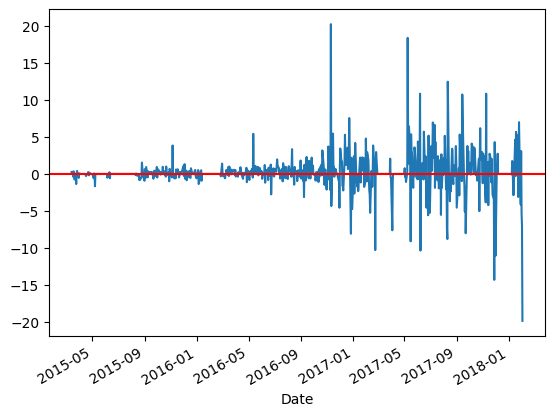
#画一个图表来显示利润/亏损
fb['Close1'] = fb['Close'].shift(-1)
fb['Profit'] = [fb.loc[ei, 'Close1'] - fb.loc[ei, 'Close'] if fb.loc[ei, 'Shares']==1 else 0 for ei in fb.index]
fb['Profit'].plot()
plt.axhline(y=0, color='red')<matplotlib.lines.Line2D at 0x17825e2bc90>
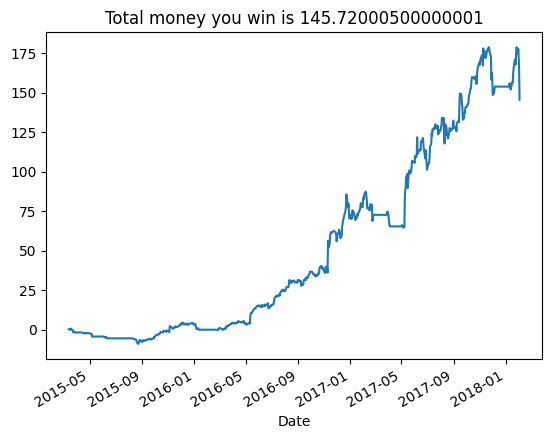
4.如果我们遵循该策略,使用.cumsum()来显示模型的性能
#Use .cumsum() to calculate the accumulated wealth over the period
#使用.cumsum()计算一段时间内积累的财富

fb['wealth'] = fb['Profit'].cumsum()
fb.tail()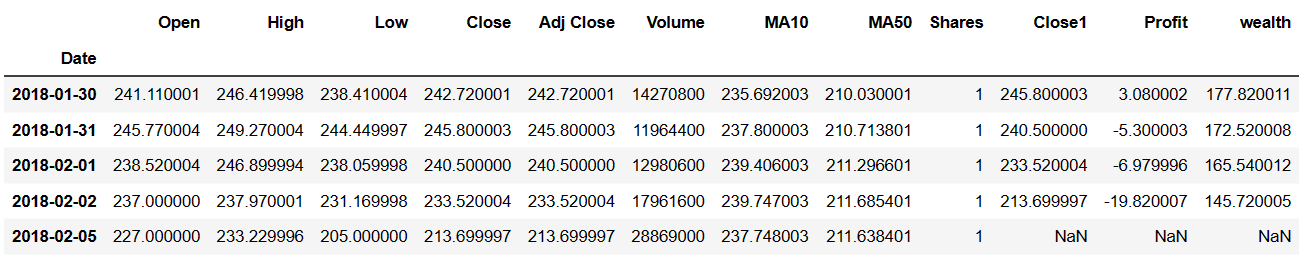
#plot the wealth to show the growth of profit over the period

fb['wealth'].plot()
plt.title('Total money you win is {}'.format(fb.loc[fb.index[-2], 'wealth']))
Text(0.5, 1.0, 'Total money you win is 145.72000500000001')