六、频率和分布
大约 2 分钟
import pandas as pd
import matplotlib.pyplot as plt
%matplotlib inline
# To recall, this is the code to mimic the roll dice game for 50 times

die = pd.DataFrame([1, 2, 3, 4, 5, 6])
trial = 50
results = [die.sample(2, replace=True).sum().loc[0] for i in range(trial)]
# This is the code for summarizing the results of sum of faces by frequency

freq = pd.DataFrame(results)[0].value_counts()
sort_freq = freq.sort_index()
print(sort_freq)
3 3
4 5
5 4
6 11
7 14
8 2
9 4
10 1
11 3
12 3
Name: 0, dtype: int64
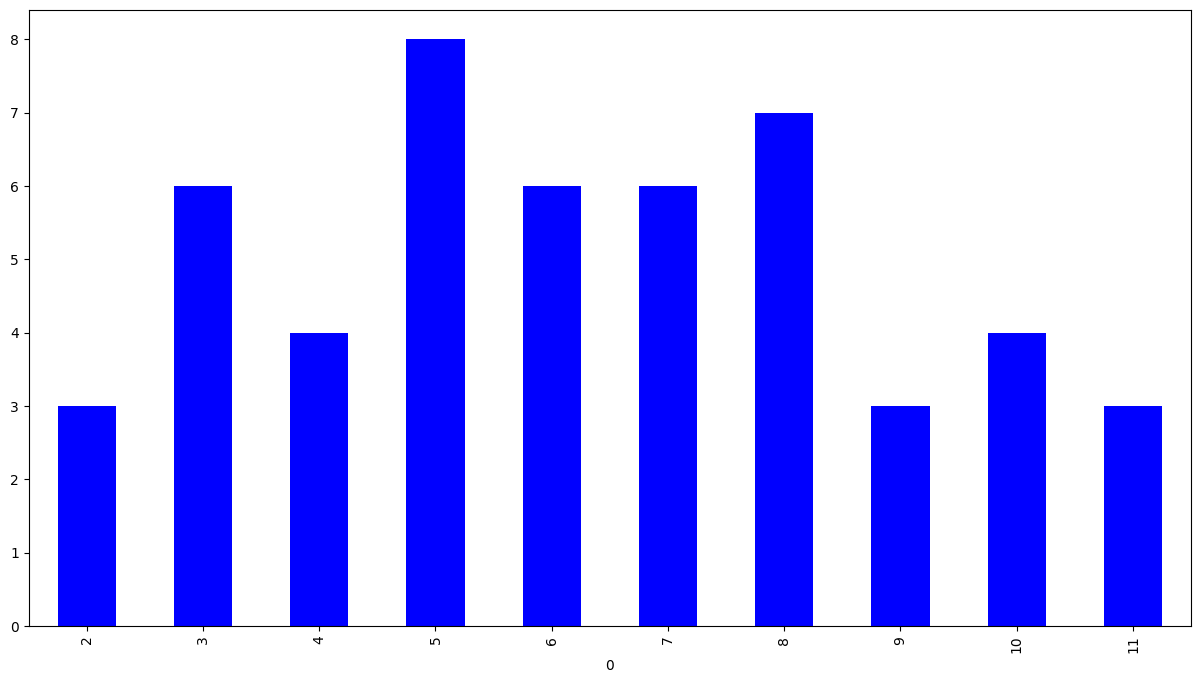
#plot the bar chart base on the result

sort_freq.plot(kind='bar', color='blue', figsize=(15, 8))
<Axes: xlabel='0'>
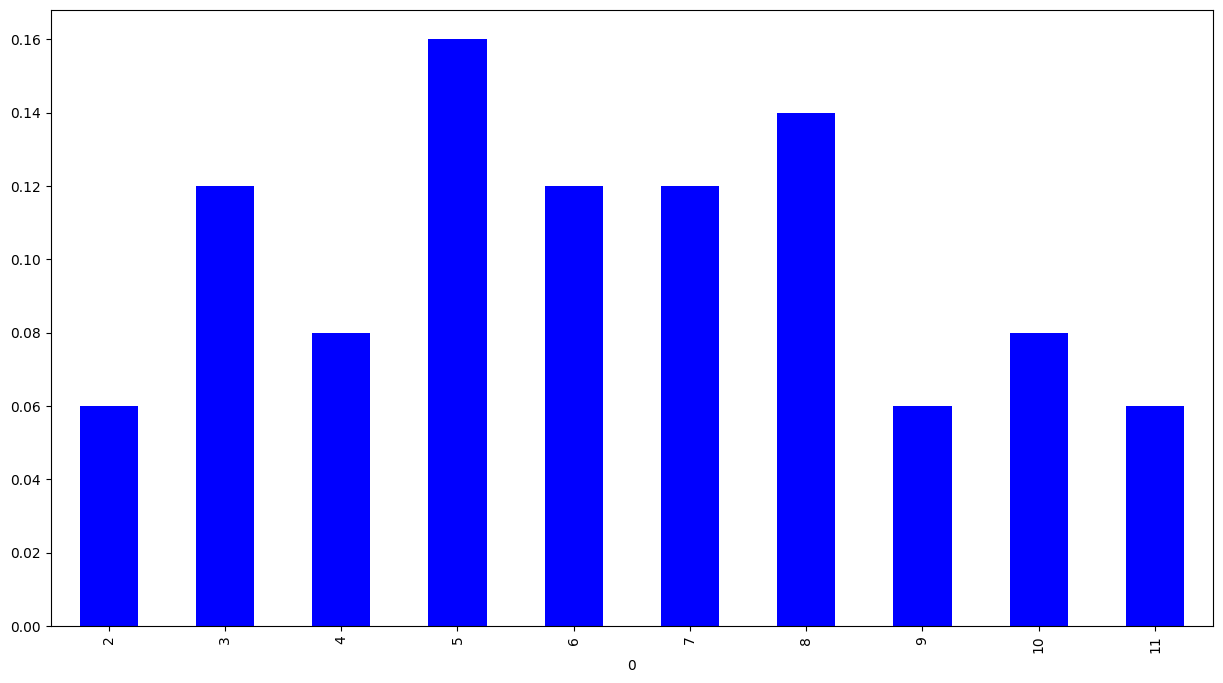
Relative Frequency
# Using relative frequency, we can rescale the frequency so that we can compare results from different number of trials
relative_freq = sort_freq/trial
relative_freq.plot(kind='bar', color='blue', figsize=(15, 8))
<matplotlib.axes._subplots.AxesSubplot at 0x7efd2dbdabe0>
# Let us try to increase the number of trials to 10000, and see what will happen...
trial = 10000
results = [die.sample(2, replace=True).sum().loc[0] for i in range(trial)]
freq = pd.DataFrame(results)[0].value_counts()
sort_freq = freq.sort_index()
relative_freq = sort_freq/trial
relative_freq.plot(kind='bar', color='blue', figsize=(15, 8))
<matplotlib.axes._subplots.AxesSubplot at 0x7efd2dc84828>
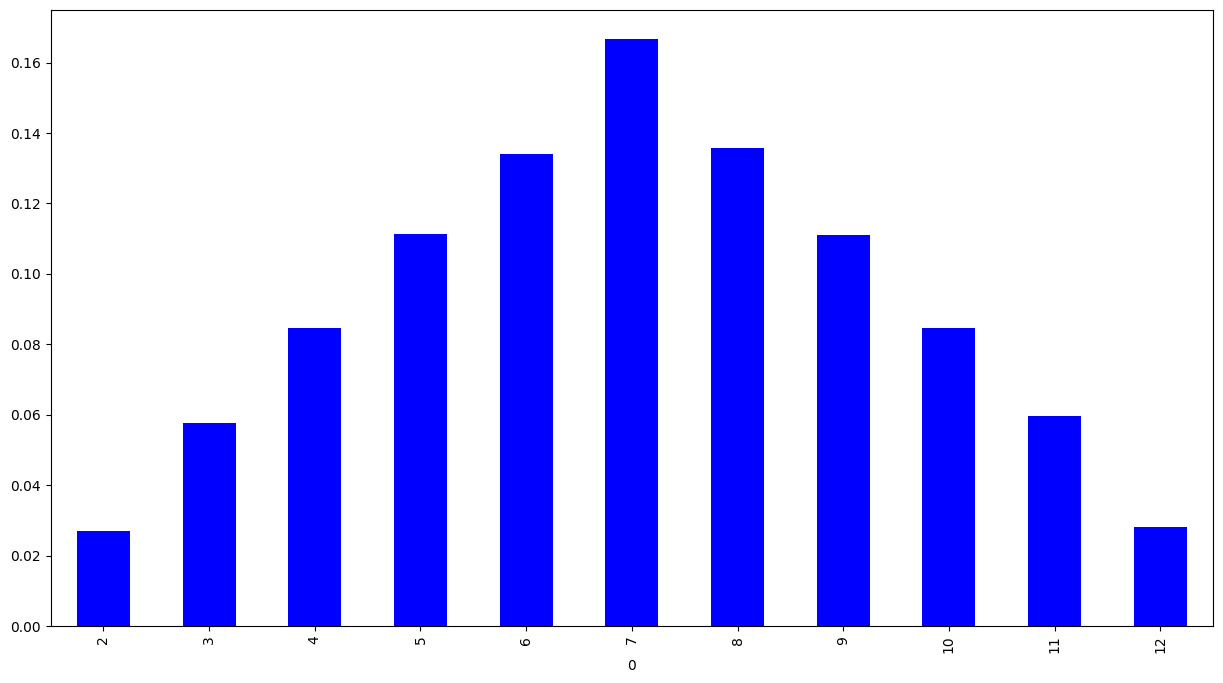
我们可以看到,随着试验次数的增加,结果越来越稳定,这非常接近于概率分布。尝试进一步增加“trial”的次数(但Jupyter Notebook可能需要一些时间才能输出结果)
Expectation and Variance of a distribution
# assume that we have fair dice, which means all faces will be shown with equal probability
# then we can say we know the 'Distribtuion' of the random variable - sum_of_dice

X_distri = pd.DataFrame(index=[2, 3, 4, 5, 6, 7, 8, 9, 10, 11, 12])
X_distri['Prob'] = [1, 2, 3, 4, 5, 6, 5, 4, 3, 2, 1]
X_distri['Prob'] = X_distri['Prob']/36
X_distri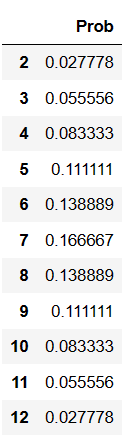
mean = pd.Series(X_distri.index * X_distri['Prob']).sum()
var = pd.Series(((X_distri.index - mean)**2)*X_distri['Prob']).sum()
#Output the mean and variance of the distribution. Mean and variance can be used to describe a distribution
print(mean, var)
6.999999999999999 5.833333333333334
Empirical mean and variance
# if we calculate mean and variance of outcomes (with high enough number of trials, eg 20000)...
trial = 20000
results = [die.sample(2, replace=True).sum().loc[0] for i in range(trial)]
#print the mean and variance of the 20000 trials
results = pd.Series(results)
print(results.mean(), results.var())
6.99505 5.864618728436524