十五、两个随机变量之间的关联
小于 1 分钟
两个随机变量之间的关联
import pandas as pd
import matplotlib.pyplot as plt
%matplotlib inline
# Import the housing information for analysis

housing = pd.read_csv('data/housing.csv', index_col=0)
housing.head()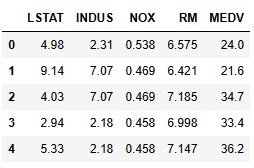
# Use covariance to calculate the association

housing.cov()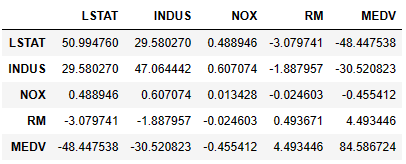
# Use correlation to calculate the association is more appropriate in this case
housing.corr()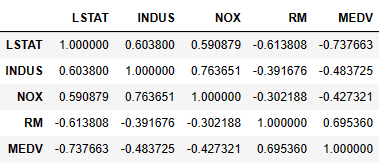
# scatter matrix plot
from pandas.plotting import scatter_matrix
sm = scatter_matrix(housing, figsize=(10, 10))
Let's do an analysis by yourself!
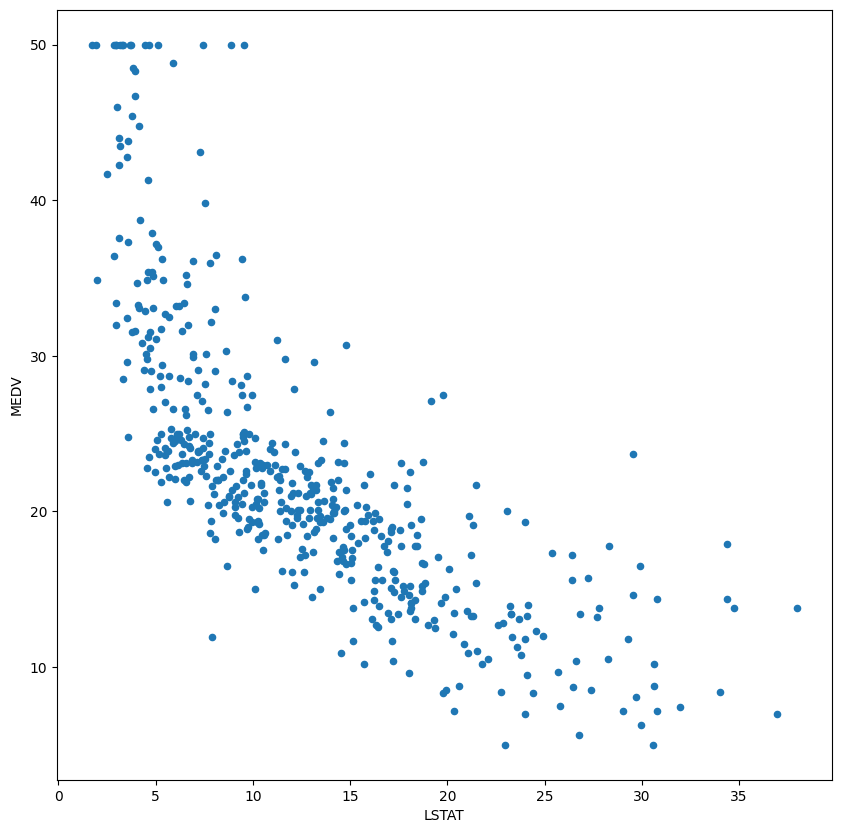
Observe the association between LSTAT and MEDV:
# This time we take a closer look at MEDV vs LSTAT。 What is the association between MEDV and LSTAT you observed?
housing.plot(kind='scatter', x='LSTAT', y='MEDV', figsize=(10, 10))
<matplotlib.axes._subplots.AxesSubplot at 0x7fd99916a0b8>